
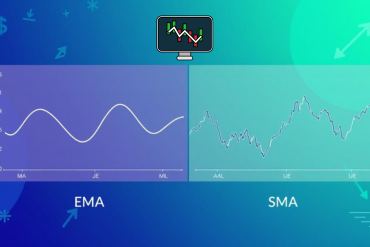
Moving averages are essential tools in technical analysis. They help traders identify price trends by smoothing out data. The two most common types are the Simple Moving Average (SMA) and the Exponential Moving Average (EMA). While both are used to track trends, they differ in how they are calculated and how quickly they respond to price changes. Below are ten key differences between them:
1. Calculation Process
- SMA: It calculates the average by adding closing prices over a chosen period and dividing by the number of periods. All data points are treated equally.
- EMA: This method gives more importance to recent prices, making it more reactive to current market movements.
2. Weight Distribution
- SMA: Each data point within the period has the same weight or impact.
- EMA: Recent prices are given higher weight, while older prices carry less influence.
3. Responsiveness to Price Fluctuations
- SMA: Reacts slowly to recent price changes due to equal weighting.
- EMA: Responds more quickly, which helps in spotting sudden market movements.
4. Time Lag
- SMA: Slower to respond to changes as it considers all data equally.
- EMA: Less lag time because it prioritizes recent prices, making it quicker to adjust.
5. Trend Reversal Detection
- SMA: Takes longer to show trend reversals due to its smoothing effect.
- EMA: Detects reversals sooner since it focuses on recent price activity.
6. Preferred Use in Strategies
- SMA: Commonly used in long-term strategies. Its smooth line helps reduce noise and false signals in volatile markets.
- EMA: Favored by short-term and active traders. Its fast response allows quicker trade decisions.
7. Effectiveness in Identifying Trends
- SMA: May delay trend recognition because of slower response.
- EMA: Better for spotting new trends early due to its sensitivity to price movement.
8. Ease of Calculation
- SMA: Simple to calculate manually—just an average.
- EMA: Requires a multiplier and past values, making it more complex. However, most trading platforms do the math automatically.
9. Performance in Different Market Conditions
- SMA: Offers a stable view of the long-term trend but might miss short-term changes.
- EMA: Adjusts quicker to market changes, making it suitable for fast-moving environments.
10. Use in Technical Indicators
- SMA: Commonly used in tools like Bollinger Bands that need a stable average.
- EMA: Forms the basis of dynamic indicators like MACD and PPO, which require quick reaction times.
Final Thoughts
The choice between SMA and EMA depends on your trading goals. If you’re focusing on long-term trends, the SMA’s stability might be a better fit. If you prefer fast reactions to market moves for short-term trading, the EMA is likely more useful. Testing both on different charts can help determine which one best supports your strategy.